Data Dashboard
Symphony Math® offers a Dashboard and many different data views to help teachers guide classroom instruction and document student progress.
Use and Progress
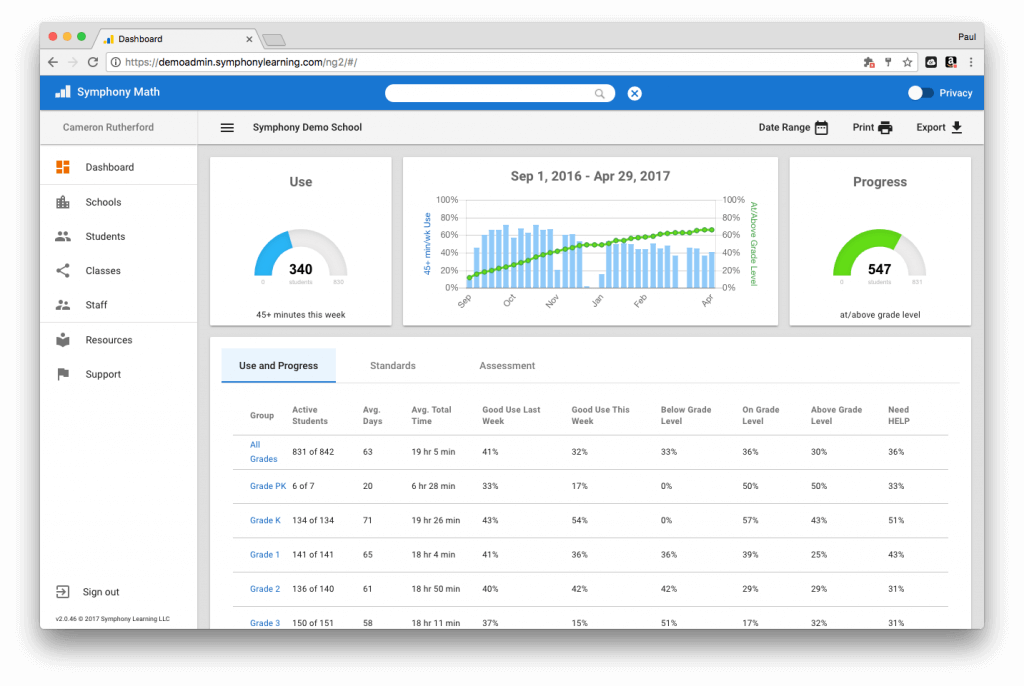
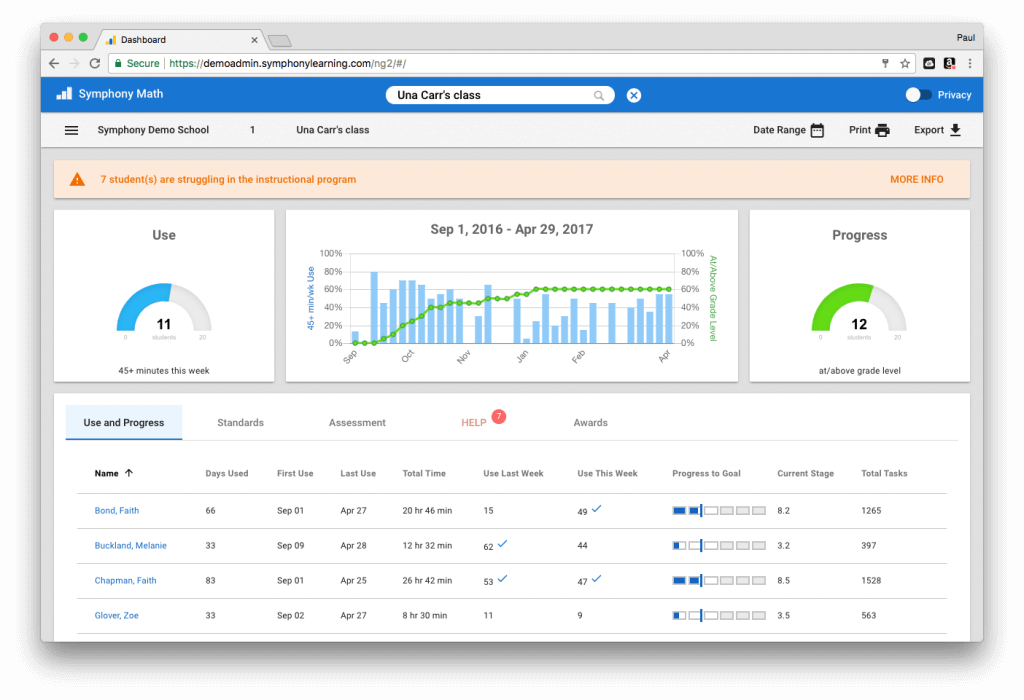
The Use and Progress data view focuses on group statistics for consistent usage and student progress towards grade-level (and above) work in the Symphony Math instructional program. The top graphs display the percentage of students using the program at least 45 minutes during the current week (in blue) and the percentage of students working at or above grade level in the curriculum (in green). Drill down to a class or student view for more specific data views for the group or student:
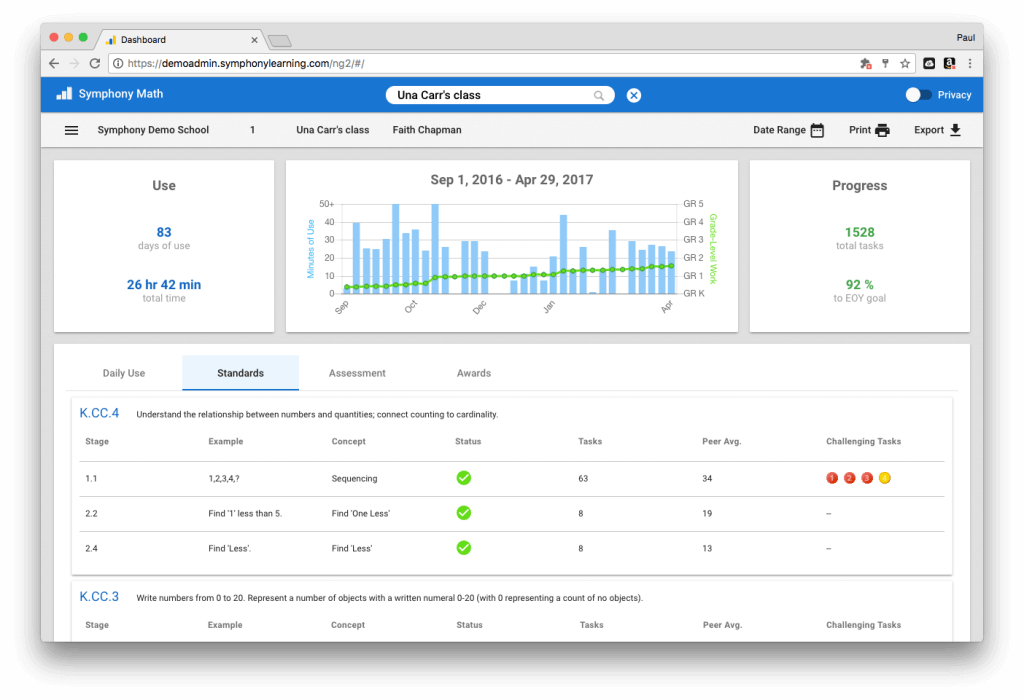
Standards
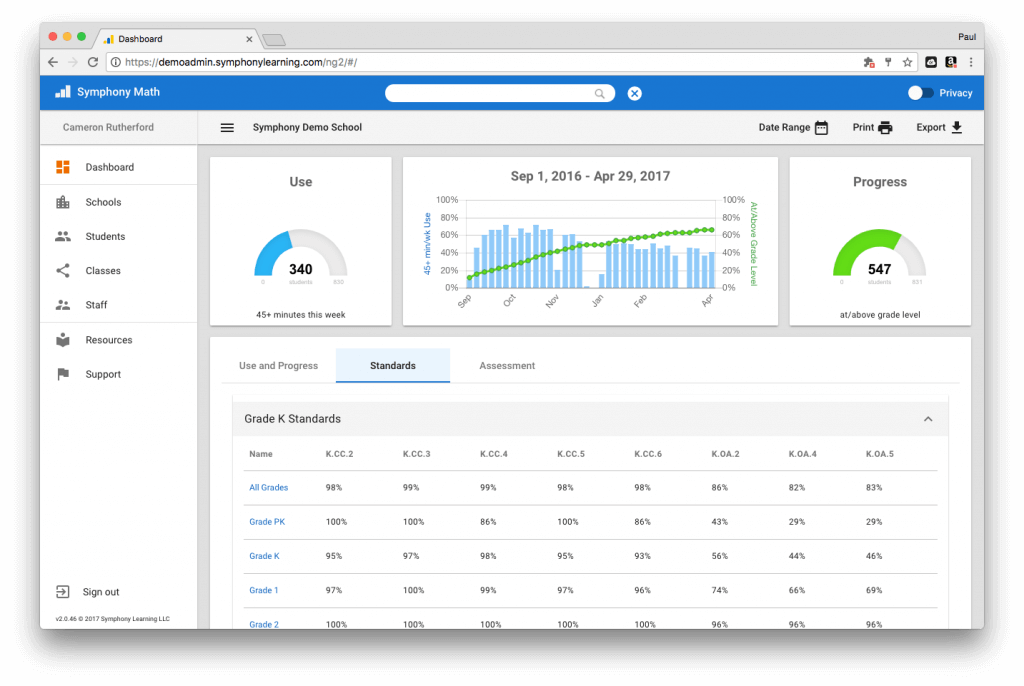
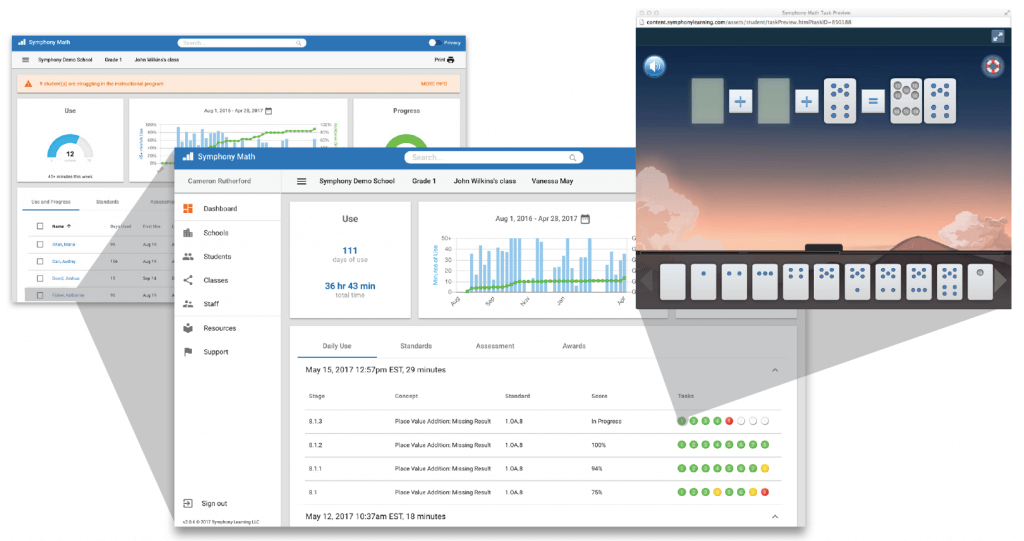
The Standards data view shows statistics for mastery in the Common Core State Standards – Mathematics (CCSS-M). The data view is arranged by grade levels, and shows the percentage of students who have mastered CCSS skills that are worked on throughout the Symphony Math curriculum. Drill down to the student level to see specific mastery data for every standard:
Assessment
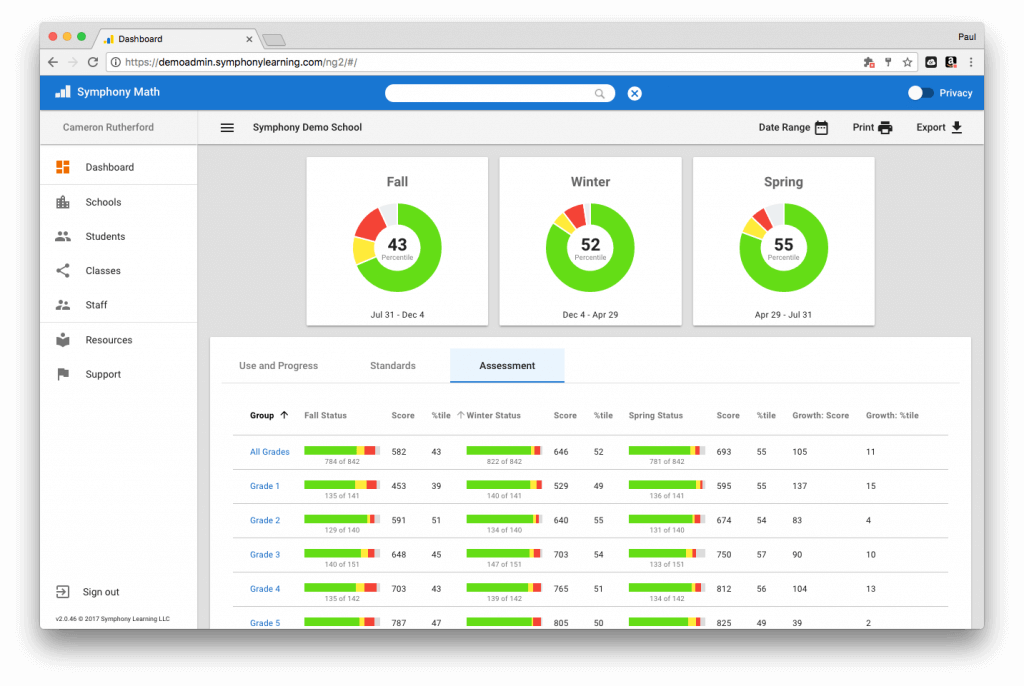
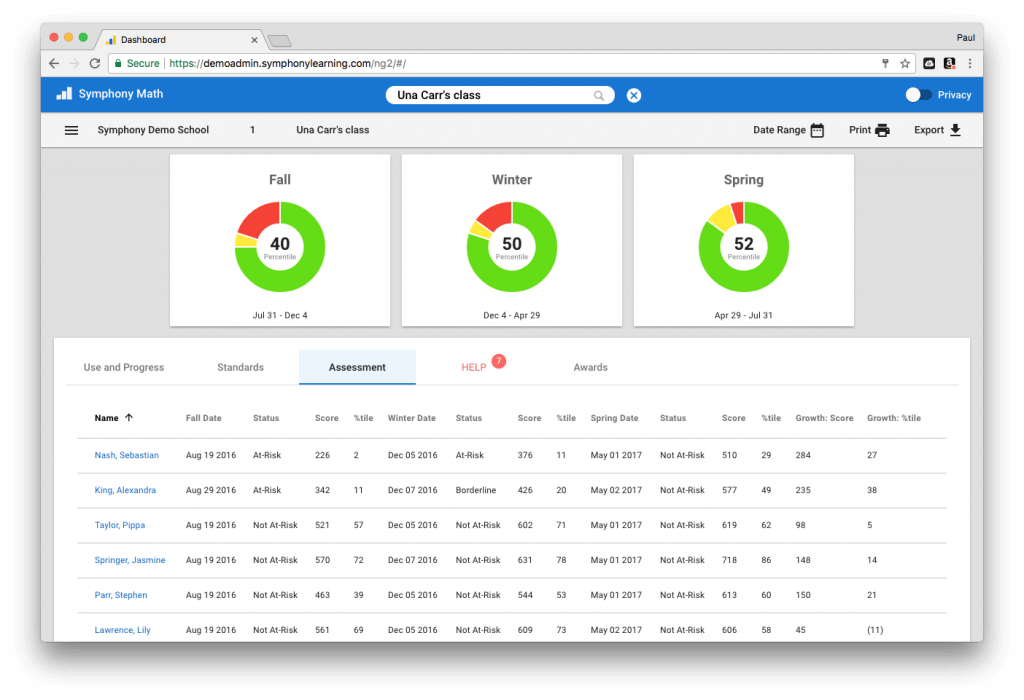
The Assessment data view summarizes group performance in each of the three independent assessments given during the school year. The top graphs show the distribution of At-risk, Borderline, and Not At-Risk students during each testing window. The available testing dates are shown at the bottom of each card. Drill down to the class level to see At-risk status and growth information for each student:
HELP
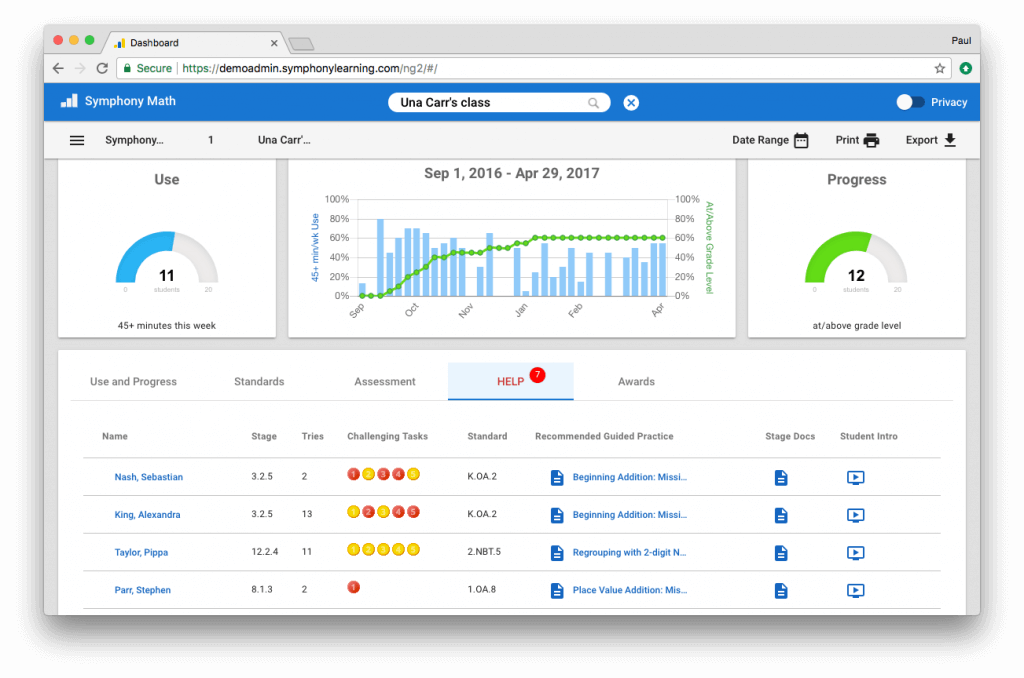
The HELP data view provides teachers with details on students that are currently struggling in the Symphony Math instructional program. When the program slows the pace of instruction as much as possible, and students cannot achieve mastery, they appear in this data view. A wealth of information is available by pressing the different areas of this view.
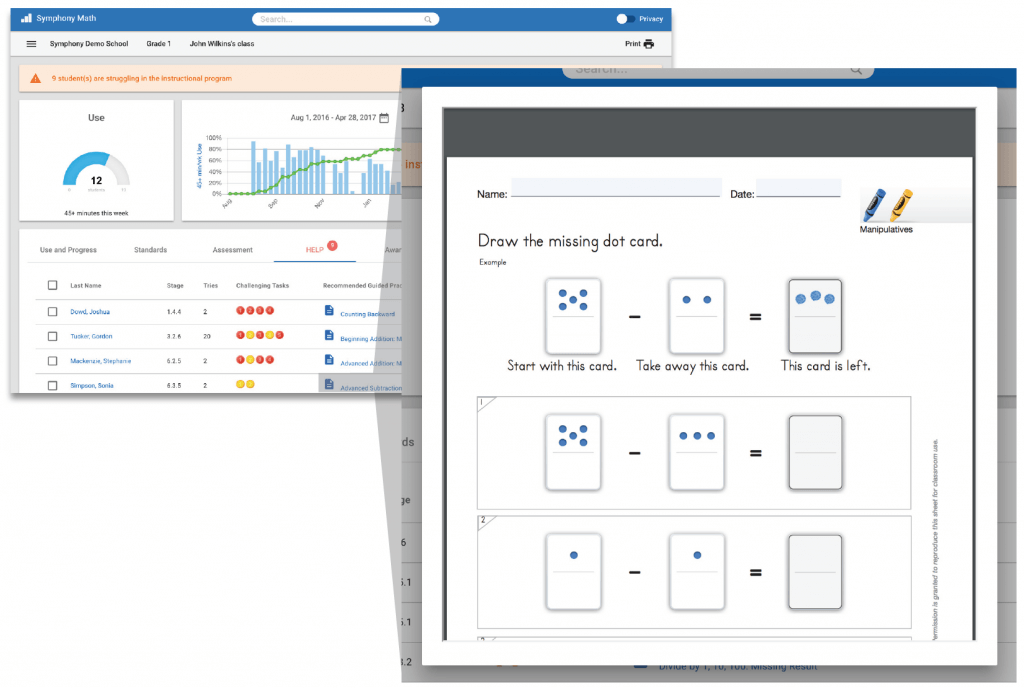
Awards
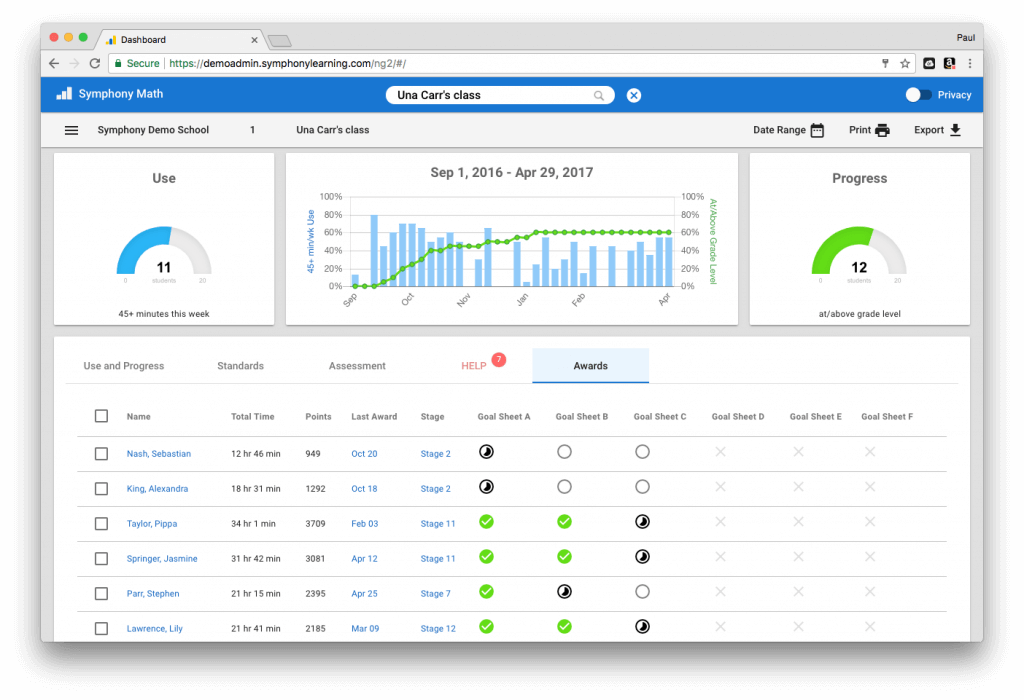
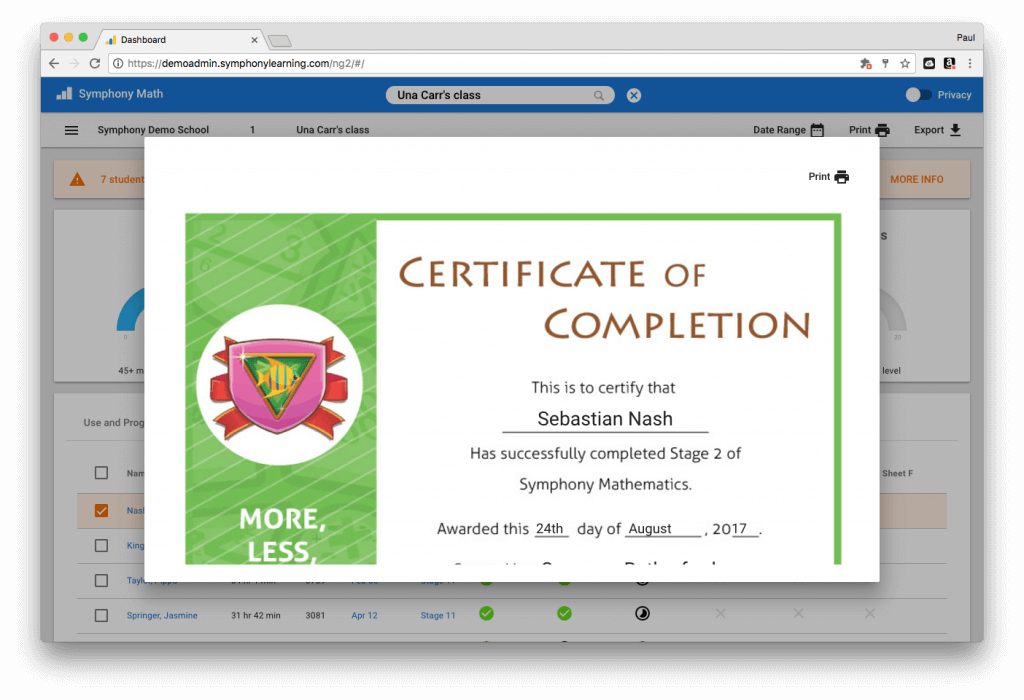
The Awards data view displays the latest certificates and Goal Sheets available for each active student in Symphony Math. Success is a great motivator. Students work very hard during their use of the program, and the rewards structure that you put in place can help students celebrate the gains they make.
Fluency
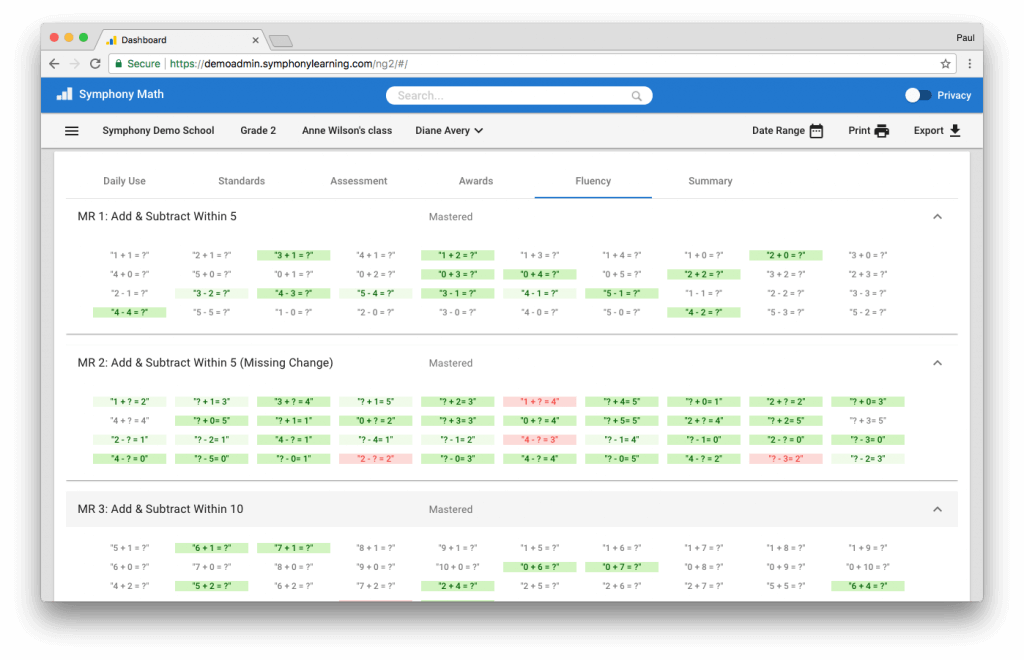
The Fluency data view displays details on student progress in the instructional program’s “Mastery Rounds.” Mastery Rounds are timed fact rounds which provide students an opportunity to practice their basic addition, subtraction, multiplication, and division facts. Mastery Rounds are timed, but students are given ample time for each fact (about 15 seconds). In this way, each Mastery Round focuses on accuracy, not speed.
Student Summary
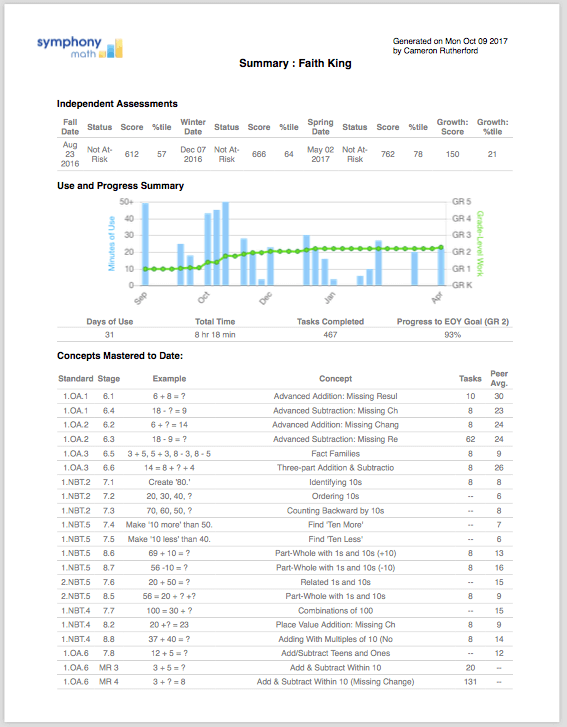
The Summary data view presents a student summary that prints out in a succinct 2-page format. The summary shows assessment results, instructional progress over time, and a listing of concepts mastered and concepts remaining for the end of year goal (end of grade level curriculum):